Reports
What do reports show?
Section titled “What do reports show?”Reports are Tovari’s summaries of what your register adds up to — where the money went, who you paid, how this month compares with the last six, and what is likely to be left at the end of the month.
Every report is worked out on the server from the same transactions your register shows, so a report and the register can never quietly disagree.
The seven reports
Section titled “The seven reports”| Report | What it answers |
|---|---|
| Spending by Category | Where the money went, broken down by category and set against your budget. |
| Spending by Payee | Who you paid, how much, and how often. |
| Spending by Month | How each month compares with the ones around it. |
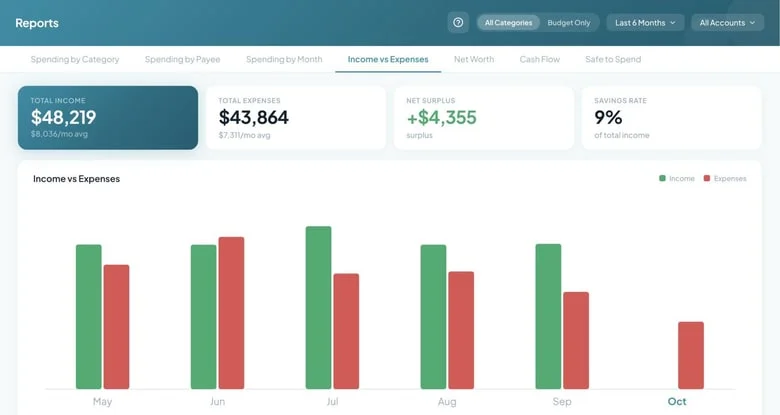
| Income vs Expenses | Both sides side by side, month by month. |
| Net Worth | What you own against what you owe, over time. Leaves out a linked loan or credit account with no reported balance and names it in a note under the total. |
| Cash Flow | Money in and out, including what is still scheduled to happen. |
| Safe to Spend | The full working of the number on your dashboard. |
Choosing the period
Section titled “Choosing the period”Every report covers a period you choose. The presets are This Month, Last Month, Last 3 Months, Last 6 Months, Year to Date and Last Year, and you can set a Custom range of your own instead.
Cash Flow is the one report that looks forward. Because it projects rather than summarises, it also offers Next 3 Months, Next 6 Months and Next 12 Months. Those forward periods are not offered on the other reports — a rollup of what already happened has no future to show — so if you pick one on Cash Flow and then move to another report, the period falls back to a historical one.
Narrowing what is counted
Section titled “Narrowing what is counted”Two filters change what a report counts, rather than when:
- Budget Only limits the spending side to categories you actually budget, so one-off categories you never planned for stop crowding the picture. Income is never filtered this way. The toggle appears on Spending by Category, Spending by Month and Income vs Expenses; the other four reports are not budget-scoped and do not offer it.
- All Accounts lets you narrow a report to particular accounts. Cash Flow starts from your Safe to Spend accounts instead, because that is the set the projection is about, and tells you which scope it used underneath the figures.
Once Tovari has linked the two sides of a transfer between your own accounts, that movement is never counted as spending or income — moving money from checking to savings is not an expense, and a linked pair is left out everywhere. A transfer Tovari has only detected but you have not yet confirmed in the Review Center still counts on both sides until you do: an amber notice on Spending by Category, Spending by Payee, Spending by Month and Income vs Expenses tells you how many possible transfers and how much money are affected, with a link straight to the Review queue to confirm or dismiss them. The Safe to Spend tab carries the same kind of notice when its automatic cushion is built from spending that includes unconfirmed transfers.
Spending that your bank has not finished posting is counted in Spending by Category, Spending by Payee and Spending by Month like any other spending. When some of the total is still pending, a line with the Total Spent figure says how much, for example “Spending includes $12.50 not yet posted” (a pending refund lowers that amount). In the transactions behind a payee, each pending one is marked Not yet posted. On Cash Flow, money you moved to an account Tovari does not track counts as money out; when that is part of the Total Outflows figure, the card says so, for example “Outflows include $300.00 moved to accounts you don’t track”.
Finding your reports
Section titled “Finding your reports”Reports is in the left-hand navigation. The seven reports run across the top as tabs, and the period, Budget Only and account filters sit in the header above whichever one you are reading. All seven are available.
Reading a report
Section titled “Reading a report”Each report opens on a set of headline figures, then its chart, then the detail beneath. The period you choose carries across as you move between reports — if you were reading the last six months of spending by category, switching to spending by payee keeps those six months — except where the report you are moving to cannot offer that period, as with Cash Flow’s forward ranges.
Following a number to its transactions
Section titled “Following a number to its transactions”Two reports let you keep going rather than stopping at the chart:
- On Spending by Month, open a month to see the payees that made it up.
- On Spending by Payee, open a payee to see the individual transactions behind the total.
This is the fastest route from “that month looks wrong” to the transaction that explains it.
On a phone browser
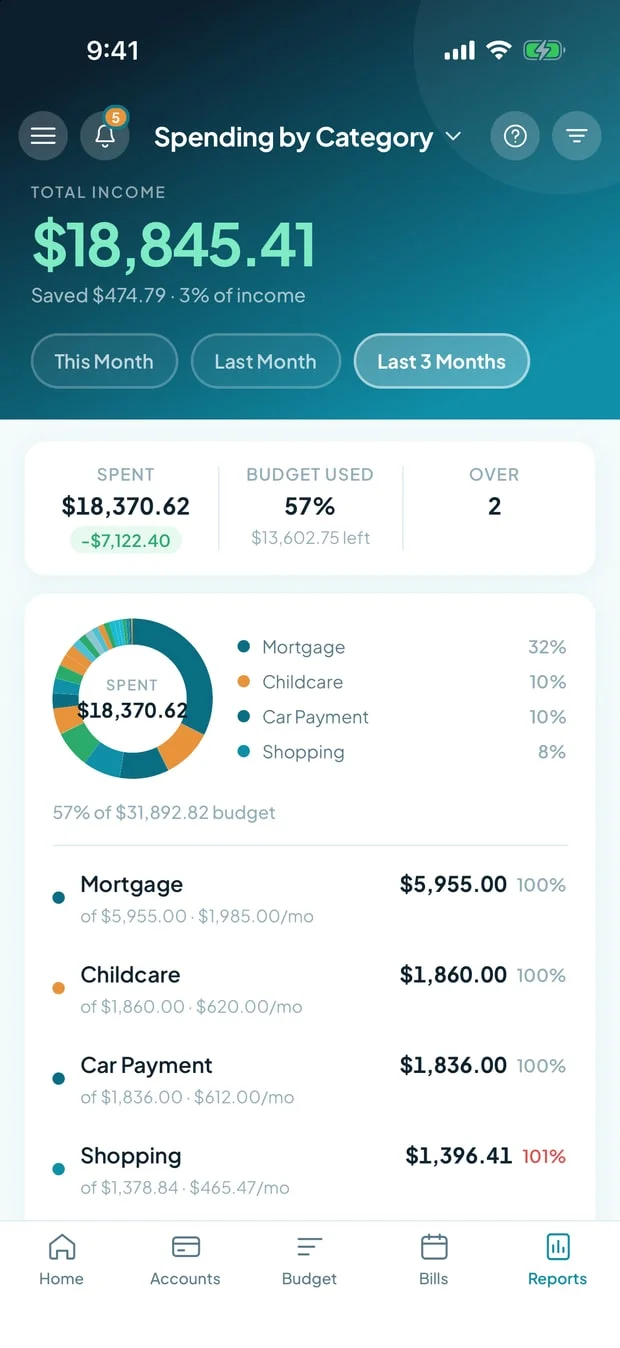
Section titled “On a phone browser”Reports on a phone browser works the way it does in the mobile app. The report name at the top of the screen is the switcher: tap it to open the list and choose another report. The headline figure for the report sits under it, with three period chips — This Month, Last Month and Last 3 Months — and a filter button in the header. The filter sheet has the full list of periods, including a custom range of up to twelve months, an account filter, and the Budget Only toggle on Spending by Category, Spending by Month and Income vs Expenses. A dot on the filter button, and a chip under the header, tell you when a filter is on.
All seven reports are laid out for the phone, and everything on them is a tap — nothing waits for a hover, and the page never scrolls sideways:
- Spending by Category — tap a category to see the payees behind it.
- Spending by Payee — tap a payee to see its recent transactions, and use the sort chips to order the list by amount, count or name.
- Spending by Month — tap a month, in the chart or in the list, to see its income, what you saved, how it compares with the month before and its top categories. Tap one of those categories to see the payees behind that spending.
- Cash Flow — the band shows net cash flow, with This Month, Next 3 Months and Last 3 Months as the chips; the filter sheet adds Next 3, Next 6 and Next 12 Months, and a custom range can reach up to a year ahead. A strip gives money out and net cash flow with what is still scheduled underneath, a chart shows your balance through the window — a solid line for what has happened and a dashed one for what is scheduled — and a switch under it lists your top outflow categories or top inflow sources. Cash Flow starts from your Safe to Spend accounts; the sheet’s first two rows switch between Safe to Spend accounts and All accounts, and a line under the strip says which scope the figures use.
- Income vs Expenses — a strip with income, expenses and net, then a card with one row per month, newest first. Tap a month to load the breakdown underneath: where that month’s income came from and which expense categories took it.
- Net Worth — assets, debts and the change over the period, a trend chart that leaves a gap for a month in which none of your selected accounts existed, and the month-by-month details.
- Safe to Spend — the same figure as on your dashboard, with a card for each account showing its balance, the bills due from it and what is clear to spend. Safe to Spend does not depend on a period, so it has no period chips; the account filter changes which account cards you see, while the totals stay for all of your eligible accounts.
The amber notice about possible transfers has a Review button that opens Alerts. For sustained reading — comparing months, following a payee down to its transactions — the PC or Mac layout has considerably more room.
Finding your reports
Section titled “Finding your reports”Reports is in the app’s main navigation. Rather than a row of tabs, the report name at the top of the screen is the switcher: tap it to open the list and choose another report.
The five reports in the app
Section titled “The five reports in the app”The app builds Spending by Category, Spending by Payee, Spending by Month, Cash Flow and Income vs Expenses, each with a one-line description in the switcher so you can tell them apart at a glance.
Choosing the period and narrowing the figures
Section titled “Choosing the period and narrowing the figures”Three period chips sit under the report name for the common choices, and the filter sheet opens the full list of presets along with the account filter and the Budget Only toggle. Cash Flow’s chips include its forward-looking periods, drawn differently so you can see at a glance which ones are projections rather than history.
When a report is narrowed, that stays visible at rest, not just while the filter sheet is open: the filter control in the header carries a small dot, and a row of chips — Budget only, and N accounts when you have picked specific ones — sits above the report itself. Tapping either chip reopens the same filter sheet. The Budget Only chip only ever appears on a report that actually supports that scope.
Following a number further
Section titled “Following a number further”Rows open in place rather than pushing a new screen. Expand a category to see the top payees behind it, a payee to see the recent transactions that make up its total, or a month to see its detail.
What the app does not do
Section titled “What the app does not do”The app does not build Net Worth or the Safe to Spend report — both are in the web app, on a PC or Mac, or in a phone browser. The Safe to Spend figure itself is on your app dashboard; it is the full breakdown that is web-only.
Related pages
Section titled “Related pages”- Safe to Spend — what the number means and how it is worked out.
- Budget — the budget the Budget Only scope filters against.
- Transactions — the register the reports are built from.
- Where each feature works — what is available on which platform.